How to Build Automated SEO Reporting That Sends Itself
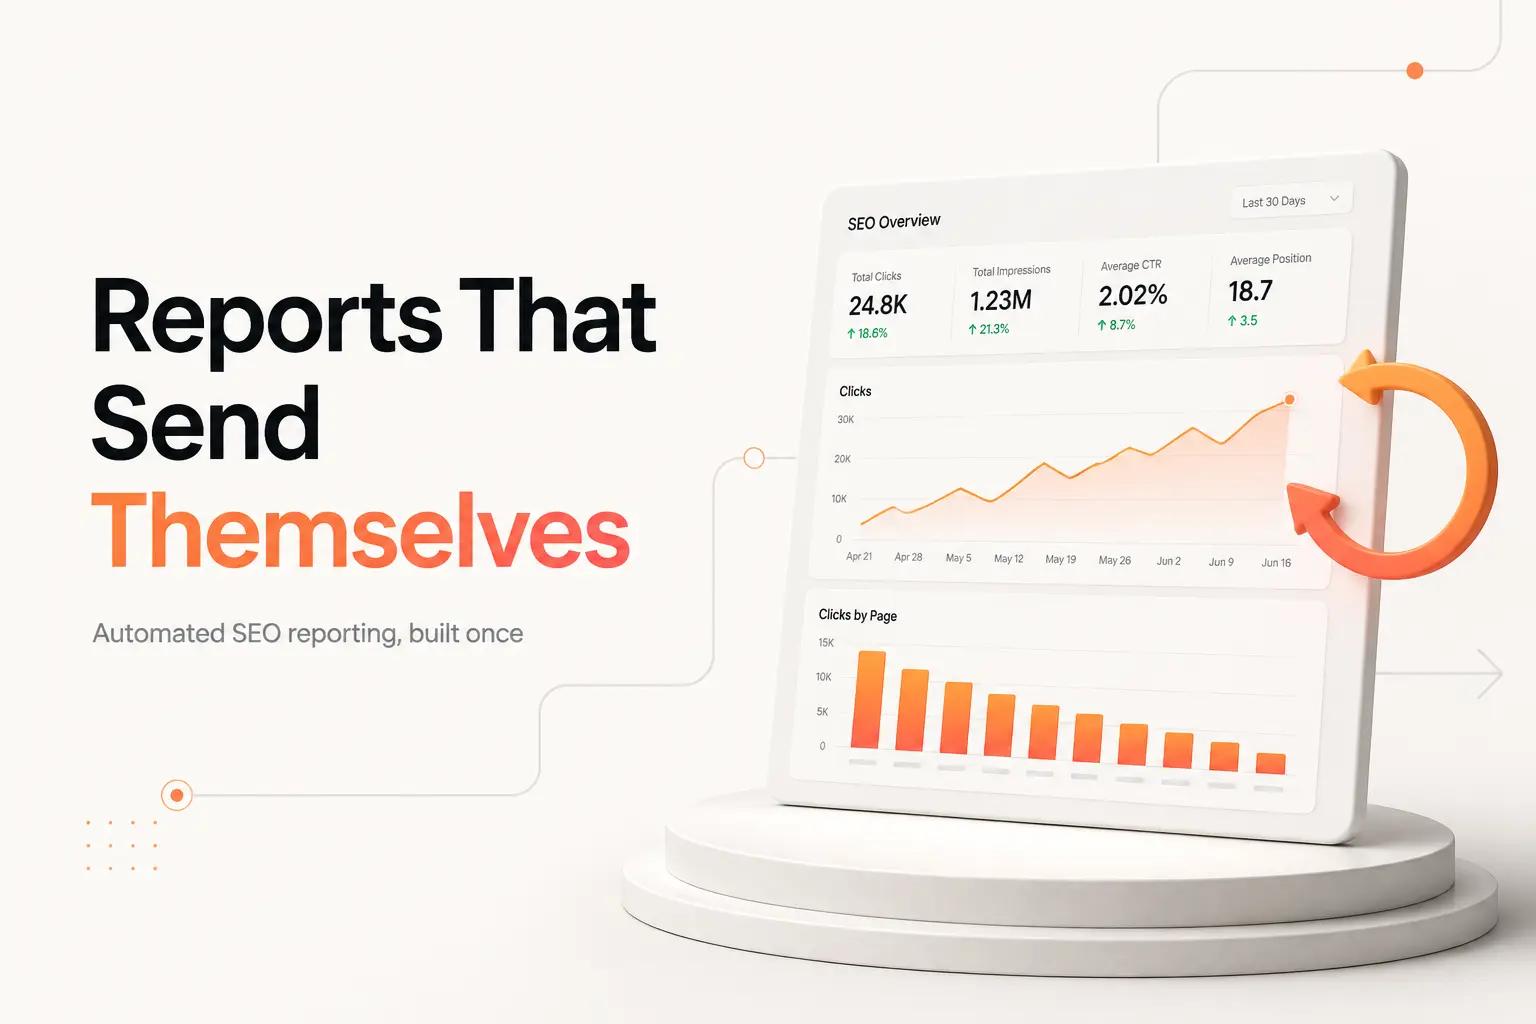
Every month it is the same 90 minutes. You export the clicks and impressions from Search Console, pull sessions and conversions out of GA4, screenshot a ranking chart from Ahrefs, and paste it all into a slide the client or the founder skims for 30 seconds. Then a number looks off, so you re-export, and the handoff slips into next week.
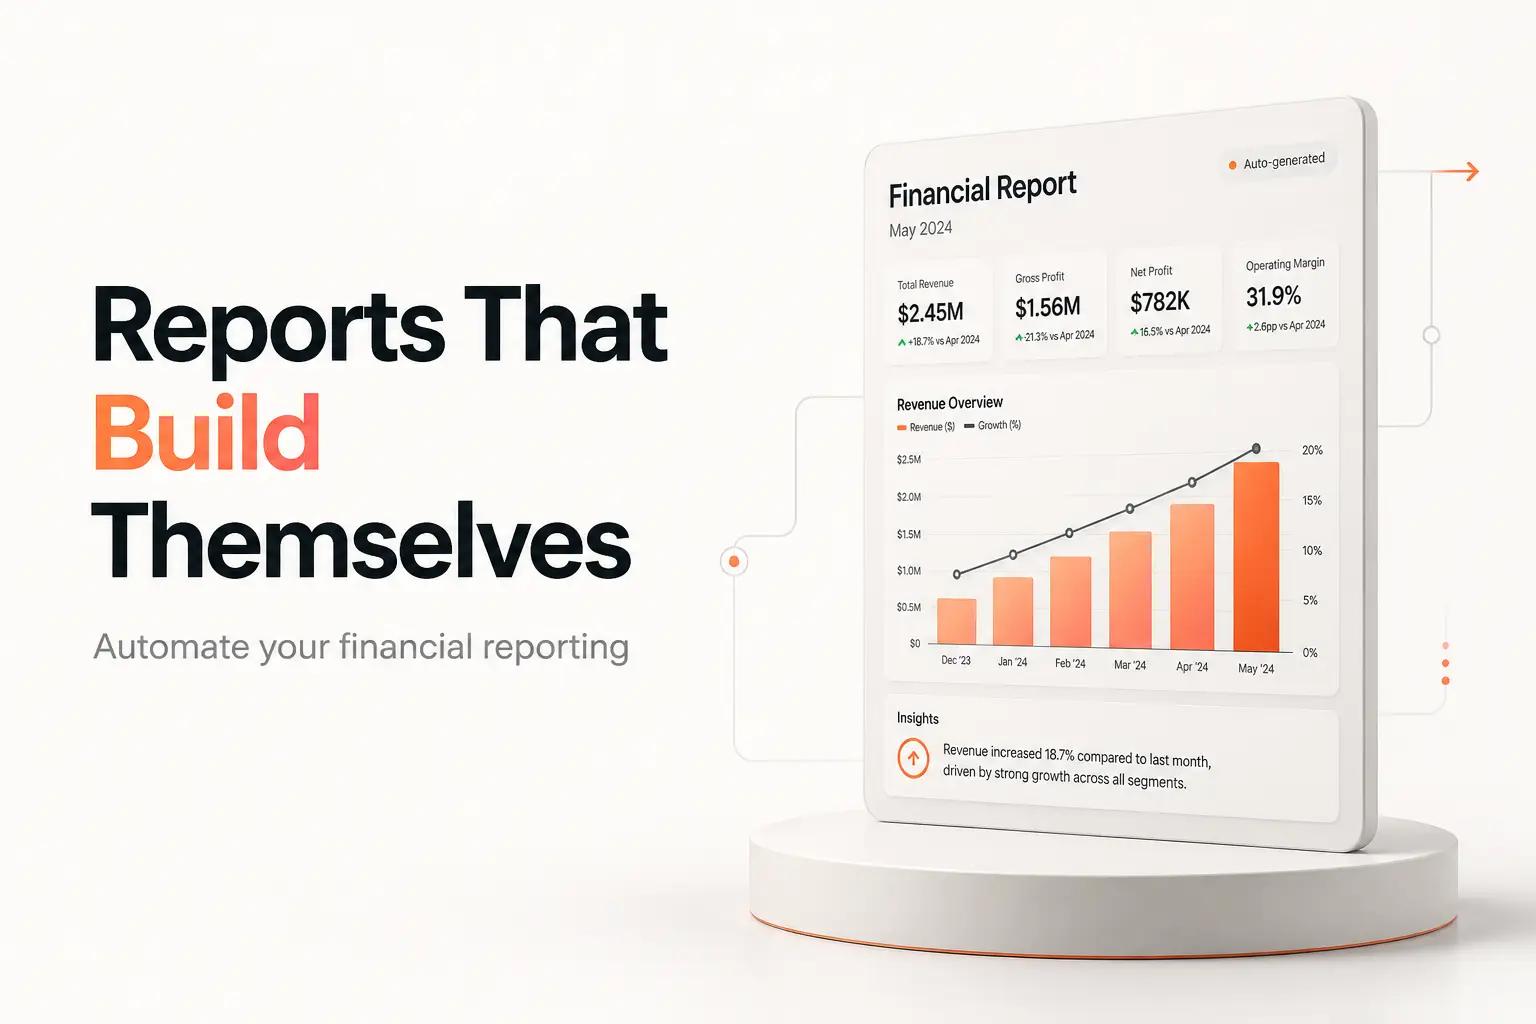
Automated SEO reporting kills that fire drill. Done right, the data pulls itself from each source on a schedule, lands in one dashboard, and shows up in an inbox or a Slack channel without anyone touching a CSV. The build is more approachable than it sounds, and most of it is free until one specific step. The trap is that the easy free version quietly breaks in ways a manual report never would, so this walks the whole thing in the order you should actually build it.
Decide what the report is answering before you touch a tool
A report nobody reads is worse than no report, because it costs you the build time and still leaves the question open. So start with the question, not the chart.
A weekly operator check-in and a monthly client deliverable are different reports. The operator wants to catch a drop before it compounds: did any high-value page lose rankings, did indexing break, did organic traffic dip week over week. The client or the founder wants the trend and the outcome: is organic growing, are the target keywords moving, did SEO drive pipeline.
Write the three to five questions the report exists to answer. Every metric that does not serve one of them is clutter. A typical split looks like this:
- Health check (weekly): clicks, impressions, average position for the pages that matter, plus any coverage or indexing errors.
- Outcome report (monthly): organic sessions, conversions or leads from organic, target-keyword movement, and the pages driving the change.
Once you know the questions, the sources pick themselves.
Pull each number from the source that actually owns it
The single biggest reason automated reports go wrong is pulling a metric from a tool that only estimates it. Rankings, clicks, traffic, and conversions each have one authoritative source. Use it.
Search Console for clicks, impressions, and position
Google Search Console is the only source of truth for how you show up in Google: real clicks, impressions, and average position straight from Google's own data. Do not proxy these with a third-party estimate.
For automation, connect the Search Analytics API rather than exporting by hand. Google documents the quota at 1,200 queries per minute per site and 30,000,000 queries per day per project, which is far more headroom than any small-team report needs, per the Search Console API limits page. The API also returns far more rows per request than the UI export gives you, so it is the better feed even if you only run it once a week. If you want indexing and coverage in the same report, the URL Inspection API is separate and capped tighter, at 2,000 queries per day per site, so batch those checks and do not point them at your whole sitemap every hour.
GA4 for what happens after the click
Search Console stops at the click. To report sessions, engagement, and conversions from organic traffic, you need Google Analytics 4, and specifically its Data API for automated pulls.
GA4's API runs on a token-based quota, not a simple request count. Google documents 200,000 tokens per property per day for standard properties and 2,000,000 for Analytics 360, and a single complex query can burn a surprising number of tokens, per the GA4 Data API quotas page. This matters the moment you connect GA4 to a live dashboard: every viewer refresh spends tokens, and a report that queries on every page load can exhaust a standard property's daily budget by mid-afternoon. The fix is to cache. Pull GA4 once on a schedule, store the result, and point the dashboard at the stored copy.
A rank tracker for positions and competitors
Search Console gives you average position, but it is averaged across queries and devices and it only covers your own site. For clean daily rank tracking on a defined keyword set, or any view of where competitors sit, you need a dedicated tool, one of the few AI marketing tools for a small business that genuinely earns its monthly fee.
The two most common are Ahrefs and Semrush. Ahrefs lists its plans at $129, $249, and $449 per month for Lite, Standard, and Advanced, per its pricing page. Semrush lists Pro, Guru, and Business at $139.95, $249.95, and $499.95 per month, per its pricing page. Most of these plans expose an API on the higher tiers, which is what you want for a report that updates itself rather than a person logging in to screenshot a graph. If you are still choosing a tracker, our rundown of the best workflow automation tools for lean teams covers how to think about which tools earn a seat in a small stack.
Wire the sources into one dashboard
With three or four feeds identified, the job is to land them in a single place that refreshes on its own. For most lean teams the practical answer is Looker Studio.
Looker Studio's core product is free, and it connects natively to Search Console and GA4 with no code, per Google's Looker pricing page. That covers a large share of what a monthly SEO report needs. The paid tier, Looker Studio Pro, runs $9 per user per project per month and mainly adds team management and support, which a small team can skip until it has a reason not to.
Here is where the free path bends. Looker Studio's native connectors are fine for Google's own data, but the moment you need Ahrefs or Semrush numbers in the same view, or you hit those GA4 token limits under live refresh, you are into connector plumbing: a paid third-party connector, a scheduled script that writes each source into a Google Sheet or a small database, and a caching layer so the dashboard reads stored data instead of hammering the APIs. That glue is the real work in automated reporting, and it is exactly the kind of integration that quietly breaks when an API token expires or a schema changes.
For a workflow that has to survive that, the pattern we build at bottta is a scheduled pipeline, not a dashboard bolted onto live connectors. A job runs on a cron, pulls each source through its API inside quota, normalizes the fields, writes them to one store, and the dashboard reads only from that store. This is our Integrations and Custom Builds work: the API auth and webhooks that hold the feeds together, and the dashboard or scheduled job that presents them. It is the difference between a report that fails silently the first time GA4 throttles it and one that keeps running while you are asleep. If you are weighing whether to assemble this yourself or bring in a team, our build vs buy vs hire breakdown walks the real costs of each path.
Add the read a raw dashboard can't give you
A dashboard shows that organic clicks fell 14% week over week. It does not tell the founder that the drop is one deindexed category page and not a Google update, which is the only sentence they actually wanted.
That interpretation layer is what turns a chart into a report someone reads. The manual version is you writing three sentences at the top every week. The automated version routes the week's numbers through an LLM that drafts the narrative: what moved, by how much, the likely cause, and what to check. This is bottta's AI Automation work, an extraction and drafting step that reads the same data the dashboard shows and writes the "so what" a human would otherwise type.
Keep it honest. The model summarizes numbers that came from Search Console and GA4, so the facts are grounded, but a human still approves the read before it ships to a client. An automated summary that hallucinates a cause is worse than a blank text box. The value is drafting speed, not unattended judgment.
Automate the delivery, not just the refresh
A dashboard that updates but that nobody opens is still a manual report, because someone has to remember to look. The last mile is delivery.
Decide the trigger and the channel per audience:
- Scheduled digest: a weekly or monthly email or Slack post with the headline numbers and a link to the live dashboard, or a generated PDF for the client who still wants a document to file. This covers most operator and client needs.
- Threshold alert: a message that fires only when something crosses a line you set, like organic clicks dropping more than 20% week over week or a tracked keyword falling off page one. This is what actually catches problems, because nobody reads the Tuesday digest closely.
The alert path is where automated reporting earns its keep, and it is more reliable than a human eyeballing a chart. A person skims the weekly report and misses the one line that mattered. A rule that watches for a 20% drop does not get tired. If you already run other automations, this is the same alerting pattern covered in our examples of business process automation that pays for itself.
Common mistakes that make automated SEO reports worse than manual ones
A bad automated report is more dangerous than a manual one, because people trust it. These are the failures we see most.
Live connectors with no caching. Pointing a dashboard straight at the GA4 API means every viewer refresh spends tokens against that 200,000-per-day budget. Under a few users it works. On the day the client opens it five times, it throttles, shows blanks, and looks broken. Cache on a schedule, always.
No monitoring on the pipeline itself. The report runs for months, then an OAuth token silently expires and the dashboard quietly shows last month's numbers as if they were current. Nobody notices until a decision is made on stale data. Every automated feed needs a heartbeat check that screams when a pull fails.
Vanity metrics that answer no question. Impressions look great and mean almost nothing on their own. If a number does not map to one of the three to five questions you wrote at the start, it is padding that hides the metric that matters.
One giant report for every audience. The founder's monthly outcome view and the operator's weekly health check are different reports. Cramming both into one deck means each reader ignores the half that is not theirs.
Trusting the summary blindly. An LLM-drafted read is a draft. Ship it to a client without a human glance and you will eventually send a confident, wrong explanation for a drop that had a simple cause.
When to build it yourself vs bring in bottta
If your report is Search Console and GA4 only, and you are comfortable in Looker Studio, build it yourself this week. The native connectors are free, the setup is an afternoon, and you do not need us for it. That is the honest answer for a single-source dashboard.
Bring in bottta when the report has to combine sources that do not connect natively, survive API quotas under real usage, and keep running without a person babysitting it. That is the work: the Integrations that authenticate and glue Search Console, GA4, and a rank-tracker API together, the Custom Build that caches them into one store and renders the dashboard, and the AI Automation that drafts the weekly read. We scope it two ways. A one-off reporting pipeline is a fit for the $4K project: fixed scope, integrations included, 30 days of post-launch support while it settles. A stack where reports keep changing, or where SEO reporting is one of several workflows you want handled, fits the $3K per month retainer: ongoing monitoring, fixes when an API shifts, and up to three active workflows at a time.
The line is simple. If it is one source and one chart, DIY. If it is a pipeline that has to not break, that is a build, and a build wants an owner. If you are still deciding whether a given report is even worth automating, our guide on when to automate a task and when not to is the gut check.
Frequently asked questions
Can I automate SEO reporting for free? Partly. Looker Studio's core product is free and connects natively to Search Console and GA4, which covers a Google-only report at no cost, per Google's Looker pricing page. You pay once you need third-party data like Ahrefs or Semrush in the same view, a connector to bridge them, or a caching layer to stay inside GA4's API quota.
Do I need Ahrefs or Semrush if I already have Search Console? Only if you need daily rank tracking on a defined keyword set or any view of competitors. Search Console gives you real clicks, impressions, and an averaged position for your own site, which is enough for many reports. A dedicated tracker adds clean per-keyword positions and competitive data, at $129 per month and up for Ahrefs or $139.95 and up for Semrush.
How often should an automated SEO report run? Match the cadence to the question. A weekly health check catches drops before they compound. A monthly outcome report shows the trend to a founder or client. Layer a threshold alert on top so a real problem, like a 20% traffic drop, reaches you the day it happens rather than at the next scheduled send.
Why does my GA4 dashboard keep showing quota errors? Almost always because it queries the GA4 Data API live on every refresh. Google caps standard properties at 200,000 tokens per property per day, and a busy dashboard burns through that fast. Pull GA4 once on a schedule, store the result, and point the dashboard at the stored copy.
What is the hardest part to automate? Not the charts. It is the plumbing that keeps three or four APIs authenticated, inside quota, and cached, plus the monitoring that catches a silent failure before a decision gets made on stale data. That reliability layer is where most DIY SEO reports quietly rot, and it is what a proper build exists to handle.
The 90 minutes you spend stitching this report every month is not the real cost. The real cost is the month you make a call on a number that was three weeks stale because a token expired and nobody noticed. A reporting pipeline that monitors itself is what buys back both. Start a project with bottta when your reporting has outgrown copy-paste and you want it built once and owned.