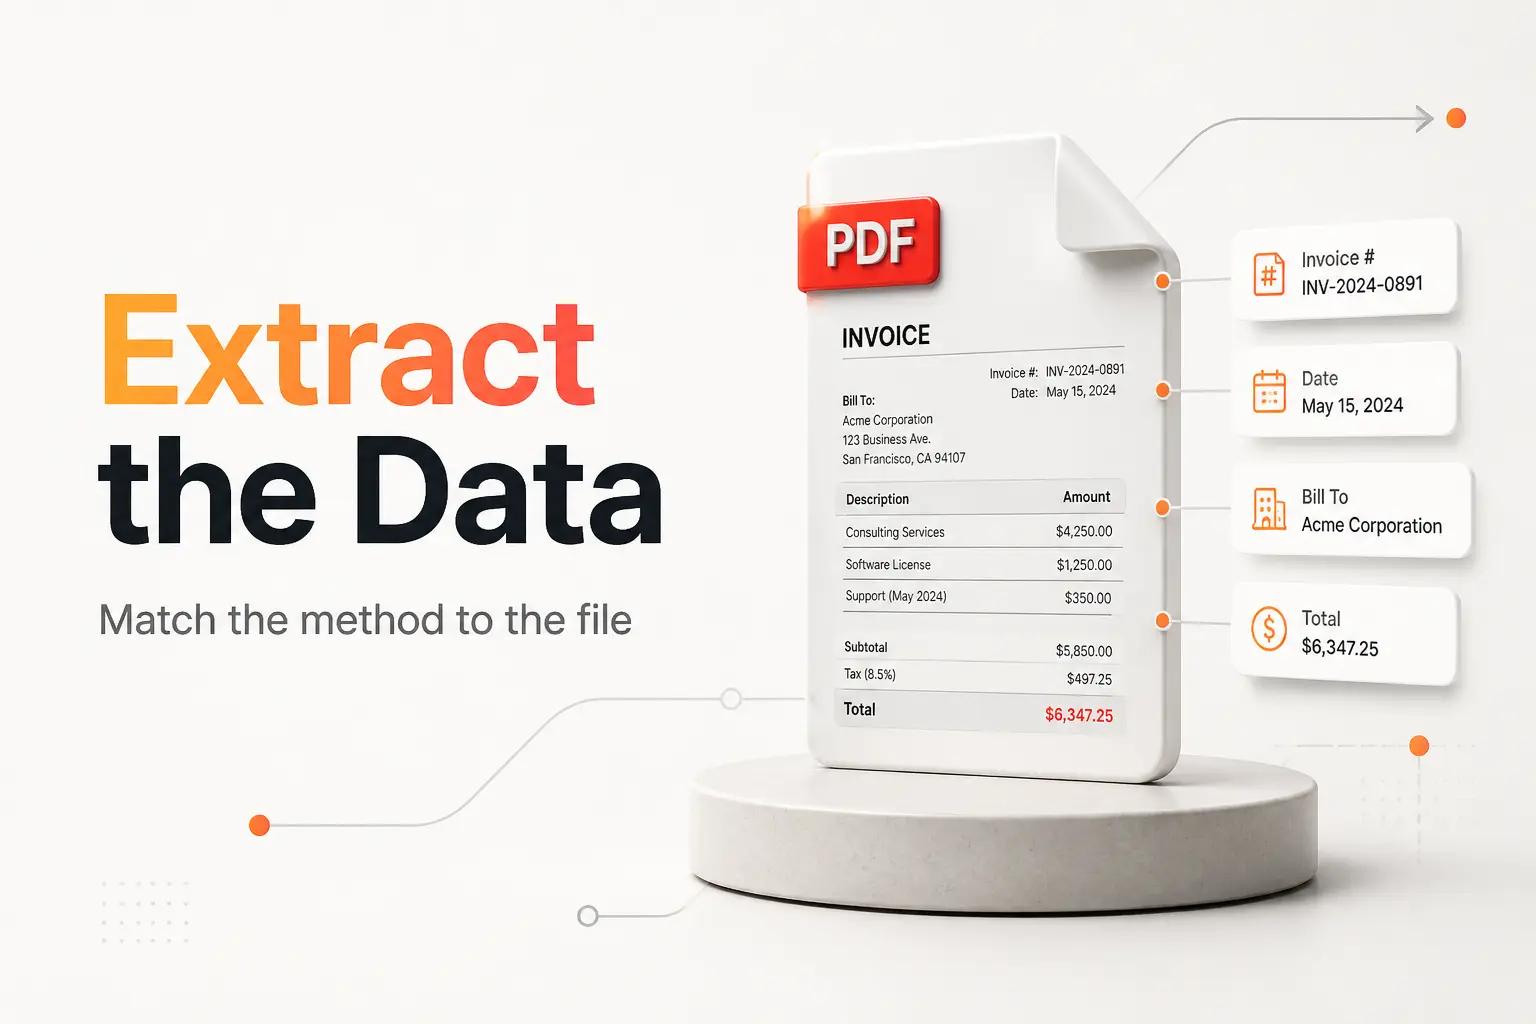
How to Generate a PDF Report Automatically (Without the Manual Export)
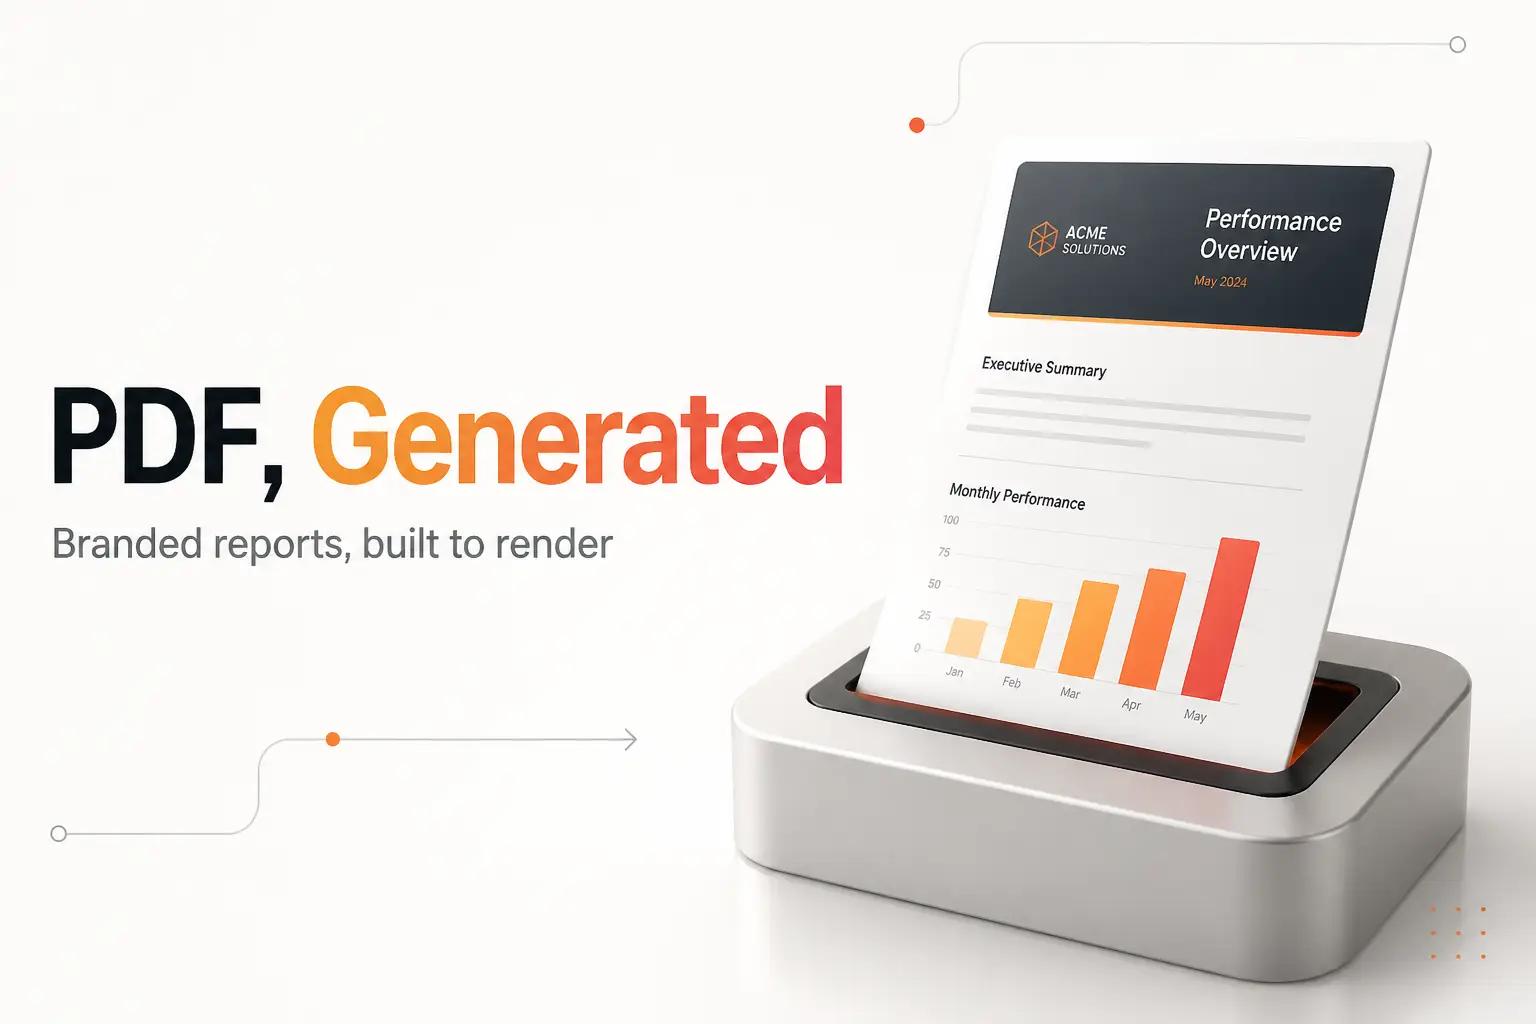
On the first of every month, a client gets a PDF. Logo in the corner, a few charts, a summary paragraph, last month's numbers laid out cleanly. It looks polished. Behind it, someone on your team spent 40 minutes: exporting a dashboard to an image, pasting it into a Google Doc or a Canva template, retyping the numbers, fixing the logo that shifted, writing the summary, then File > Download > PDF, rename, attach, send. Twelve clients, twelve times, every month.
That last-mile assembly is what "generate a PDF report" actually means for most teams. Not the analytics. The document. The branded artifact a client, a board member, or a lender opens and judges you by. And it is the one part of the reporting pipeline people keep doing by hand, because the tools that pull the data do not know how to lay out a page.
The good news is that the document layer is more mechanical than it looks. Once you stop treating the report as a design task and start treating it as a rendering pipeline, it becomes a set of solved steps you build once and never touch again. None of it assumes a dedicated design-ops engineer, just a founder or ops lead willing to treat the page as a pipeline instead of a monthly craft project.
First, decide what "report" you actually mean
"Generate a PDF report" hides two very different jobs, and the build forks hard depending on which one you have.
The first is a dashboard snapshot. You already have charts in Looker Studio, Metabase, or a BI tool, and you just want them emailed as a PDF on a schedule. That is a delivery problem, and most of those tools can schedule an export themselves. If that is all you need, you do not need this guide. You need automated reporting tools that pull the data and deliver the report, and the schedule feature is often built in.
The second is a branded document. A monthly client performance report, a financial statement pack, an invoice, a certificate, an inspection report. It has your layout, your fonts, per-recipient data, prose that changes each time, and it has to look right on the page. A dashboard export cannot produce this. This is the job worth automating, and the rest of this guide is about it.
Pin which one you have before you touch a tool. The wrong answer wastes a week building a rendering pipeline you did not need, or worse, tries to force a real document out of a screenshot.
Split the report into three layers
A generated PDF is three separate concerns, and teams get stuck because they treat it as one. Pull them apart and each becomes a solved problem.
- Data. The numbers, records, and text that change each run. Pulled from your CRM, Stripe, a database, a spreadsheet, an analytics API. This is the same sourcing work behind any report. If you have not built it yet, automated financial reporting covers mapping sources and syncing them safely.
- Template. The fixed layout: your brand, the page structure, where each number lands, the header and footer. Built once, reused every run.
- Render and deliver. The engine that fuses data into the template and outputs a PDF, plus the trigger that fires it and the delivery to wherever it is read.
The manual version fuses all three inside a human. They hold the layout in their head, look up the data, and assemble the page by hand. Automation just means giving each layer to a machine. The template becomes a file. The data becomes an API call. The render becomes a function. Once they are separate, the whole thing runs without you.
Build the template as HTML, not a design tool
The instinct is to build the template in the tool you already know: Google Docs, Canva, a Word file, a Figma frame. For a one-off, fine. For something a machine generates on a schedule, it is the wrong foundation, because none of those tools accept structured data and stamp it into a layout programmatically without a fragile export dance.
The format nearly every automated PDF pipeline uses is HTML and CSS. You build the report as a web page, leave placeholders where the data goes, and a rendering engine turns the filled-in HTML into a PDF. HTML is the right choice for three concrete reasons.
- It merges data cleanly. Templating engines (Handlebars, Liquid, Jinja) drop values into HTML with no manual step.
{{client_name}}becomes the client's name at render time. - Charts are just images or SVG. Generate the chart as a PNG or inline SVG and place it like any other element. No screenshot, no paste.
- CSS controls the page. Print-specific CSS handles page size, margins, page breaks, and repeating headers and footers, the things a web page never has to think about but a PDF lives or dies by.
That last point is where most homegrown PDFs fall apart, so it is worth knowing the mechanics. Browsers render PDFs using print CSS, not screen CSS. Puppeteer, the common Chromium automation library, documents this directly: its page.pdf() method emulates print media by default, so you style against @media print and use properties like page-break-inside: avoid to stop a table from splitting across two pages (Puppeteer docs). Design the template as if it were going to a printer, because that is exactly the pipeline.
Pick the rendering engine
This is the real decision, and it splits three ways. All three take HTML in and give a PDF out. What differs is who runs the engine and what you pay.
Option 1: A library you host
Open-source engines you run yourself. Puppeteer or Playwright drive a headless Chromium and call page.pdf(). Gotenberg is a Docker-based, open-source API that wraps Chromium and LibreOffice, so you POST an HTML file and get a PDF back, and it also merges, splits, and watermarks (Gotenberg docs). No per-document fee, full control, and your data never leaves your infrastructure. The cost is that you run the infrastructure: a server with a headful browser, memory that Chromium eats, and the maintenance when a Chromium update changes rendering. Good when volume is high or the data is sensitive.
Option 2: An HTML-to-PDF API
You send HTML, they return a PDF, they run the browsers. PDFShift offers a free tier of 50 credits per month with no card, then paid plans above it (pdfshift.io). DocRaptor runs on the Prince engine, which is built for print-quality paged media, and its plans run $0 per month for 5 documents (no overage on free), $15 for 125, $29 for 325, $75 for 1,250, and $149 for 5,000, up to $1,000 for 40,000 (DocRaptor pricing). No infrastructure, and you are billed per document. Good when volume is low to moderate and you do not want to babysit a browser.
Option 3: A template-plus-render service
These host the template editor and the renderer together, so a non-developer can edit the layout in a visual builder and the service merges data and returns the PDF. PDFMonkey is the common one: a free plan of 20 documents per month (capped at a 30-second render and no external images, fonts, CSS, or JS), then about $5 for 300 documents, $16 for 3,000, $65 for 5,000, and $325 for 60,000 (PDFMonkey pricing). Good when the layout will change often and you want it editable without a deploy.
Here is the stance. For a lean team generating a few hundred branded documents a month, start with an HTML-to-PDF API, not a self-hosted browser. The per-document cost at that volume is trivial next to the hours you would spend keeping Chromium alive, and DocRaptor's Prince engine handles page breaks and print layout more reliably than a raw headless browser. Move to a hosted library only when volume climbs past a few thousand a month or the data cannot leave your servers. Reach for a template-plus-render service when the person who owns the layout is not a developer.
| Approach | Example | You run infra | Billing | Best for |
|---|---|---|---|---|
| Self-hosted library | Puppeteer, Gotenberg | Yes | Free (open source) | High volume, sensitive data |
| HTML-to-PDF API | DocRaptor, PDFShift | No | Per document | Low to moderate volume |
| Template + render | PDFMonkey | No | Per document | Non-dev owns the layout |
Wire the trigger and merge the data
With a template and an engine chosen, the pipeline is short. Something fires it, the data gets pulled and merged, the engine renders, and the file goes out.
The trigger is either a schedule (the first of the month, every Monday at 8am) or an event (a deal closes, an inspection is submitted, an invoice is due). A schedule is a cron job or a scheduled step in a workflow tool. An event is a webhook from the source system.
The merge is where the data layer meets the template. The workflow pulls the run's data (this client's numbers, this month's range), shapes it into a clean object, and hands it to the templating engine, which fills the placeholders. For a monthly client report that means one render per client, each with that client's data. Invoices are the same pattern with different data, which is why invoice automation is really a PDF-generation pipeline wearing a finance label.
Keep the data pull and the render as separate steps. When a report comes out wrong, you want to know instantly whether the number was wrong before it reached the template or the template mangled a correct number. Fusing the two into one step hides which half broke.
Dodge the gotchas that break a PDF silently
A generated PDF fails differently from a web page. The page still renders, so nothing errors, but the output is subtly wrong and nobody notices until a client does. The ones that bite:
- Fonts that do not load. Your brand font lives on a CDN, the renderer cannot reach it, and the PDF silently falls back to Times New Roman. Note that PDFMonkey's free tier blocks external fonts and CSS entirely (PDFMonkey pricing), so a template that looks right in preview renders plain in production. Embed fonts or host them where the engine can fetch them.
- Page breaks through content. A table or a chart splits across two pages with a row orphaned at the top.
page-break-inside: avoidin print CSS pins each block together. - Charts rendered too late. If a chart is drawn by JavaScript after the page loads, the engine may snapshot the PDF before the chart appears, leaving a blank box. Render charts server-side to an image, or make the engine wait for the element.
- Render timeouts. Hosted engines cap render time. PDFMonkey's free plan cuts off at 30 seconds (PDFMonkey pricing). A heavy report with dozens of remote images can hit that ceiling and fail. Keep assets local and the document lean.
- No headers, footers, or page numbers. Web pages have none of these. A report needs them, and they come from print CSS running headers and footers, not from putting a logo at the top of the body once.
None of these throw an error. That is what makes them dangerous. Build a spot check into the pipeline: render one report, open it, look at every page, before you turn on the schedule for twelve.
Add an AI summary only where it earns its place
Many reports open with a paragraph of narrative: what changed this month, what to watch. Writing it by hand is the other manual step hiding in the report. An LLM can draft it from the same data that fills the charts, and this is a genuine use for the AI layer, not a bolt-on.
The pattern that works: feed the model the structured numbers and last month's figures, ask for a short factual summary, and gate it. The model drafts, a person skims before the report ships to a client, or you keep it to internal reports where a wrong sentence costs less. Never let a model invent a number. It writes the prose around numbers your data pipeline already computed. For where the guardrails matter, automating data entry covers the same confidence-gate discipline for anything a model touches.
When to build it yourself vs bring in bottta
If you need a dashboard emailed on a schedule, build it yourself. The BI tool exports a PDF, a workflow tool sends it, and you are done in an afternoon. Do not hire anyone for that.
The build gets worth handing off when the report is a real document with per-recipient data, a branded template that has to look right, a data merge across two or three systems, and a schedule that has to run untouched every month. That is a template built in HTML, a rendering engine wired to a data pull, print CSS tuned so nothing breaks across pages, delivery to email or Slack or Drive, and monitoring so a silent failure does not go out to a client. It is not hard for someone who does it for a living, and it is a week of frustrating trial and error for someone who does not.
That is the build bottta does. We are an automation studio: we map the report you generate by hand, design the template, pick the rendering engine that fits your volume and data, wire the workflow that pulls the data and triggers the render, and set up the delivery and the checks. It lands as Workflow Design, Integrations, and Custom Builds, with an AI Automation layer when the report needs a drafted summary. Two ways to work with us: a $4K fixed-scope project when it is one report pipeline with a clear spec and integrations included, or the $3K/month retainer when you have several reports and want them monitored and adjusted as your data and layout change. No free tier, no self-serve button, and no Chromium instance for you to keep alive.
The manual export is the last mile of a report that already exists as data somewhere in your stack. It is also the mile every team keeps walking by hand, because pulling the numbers feels like the hard part and laying out the page feels like something you just do. Flip that. The numbers are a solved problem. The document is the build. Start a project with bottta and hand off the page.
Frequently asked questions
What is the easiest way to generate a PDF report from data?
For a low volume of branded documents, an HTML-to-PDF API is the fastest path. You build the report as an HTML template, drop in placeholders, and post the filled-in HTML to a service like DocRaptor or PDFShift, which returns the PDF. No servers to run. You pay per document, and free tiers exist to test with: DocRaptor allows 5 documents a month free, PDFShift 50 credits (DocRaptor pricing, pdfshift.io).
Should I use a library or an API to generate PDFs?
Use an API for low to moderate volume, a self-hosted library for high volume or sensitive data. A library like Puppeteer or Gotenberg is free and open source but you run the infrastructure, including a headless Chromium that consumes memory and needs maintenance. An API removes that at a per-document cost. Below a few thousand documents a month, the API almost always costs less once you count the engineering time.
How do I stop a table from breaking across two pages in a PDF?
Use print CSS. Rendering engines built on Chromium emulate print media, so page-break-inside: avoid on a table or chart block keeps it from splitting, and you style the whole report against @media print rather than screen styles (Puppeteer docs). Test with real data, since a table that fits with three rows may break with thirty.
Can I generate a different PDF for each client automatically?
Yes, and that is the standard pattern. The template is fixed, the data changes per run. The workflow loops over your client list, pulls each client's data, merges it into the template, renders one PDF per client, and delivers each to the right place. It is the same build whether you are producing monthly reports, invoices, or statements.
Why does my generated PDF look different from the HTML preview?
Almost always fonts or timing. The renderer could not reach your brand font and fell back to a default, or a JavaScript-drawn chart had not finished when the PDF was captured, leaving a blank space. Embed or locally host fonts, render charts to images server-side, and confirm the engine waits for content before snapshotting. Some hosted plans also block external resources outright, which produces the same mismatch.