How to Automate Your Financial Reporting Without Breaking It
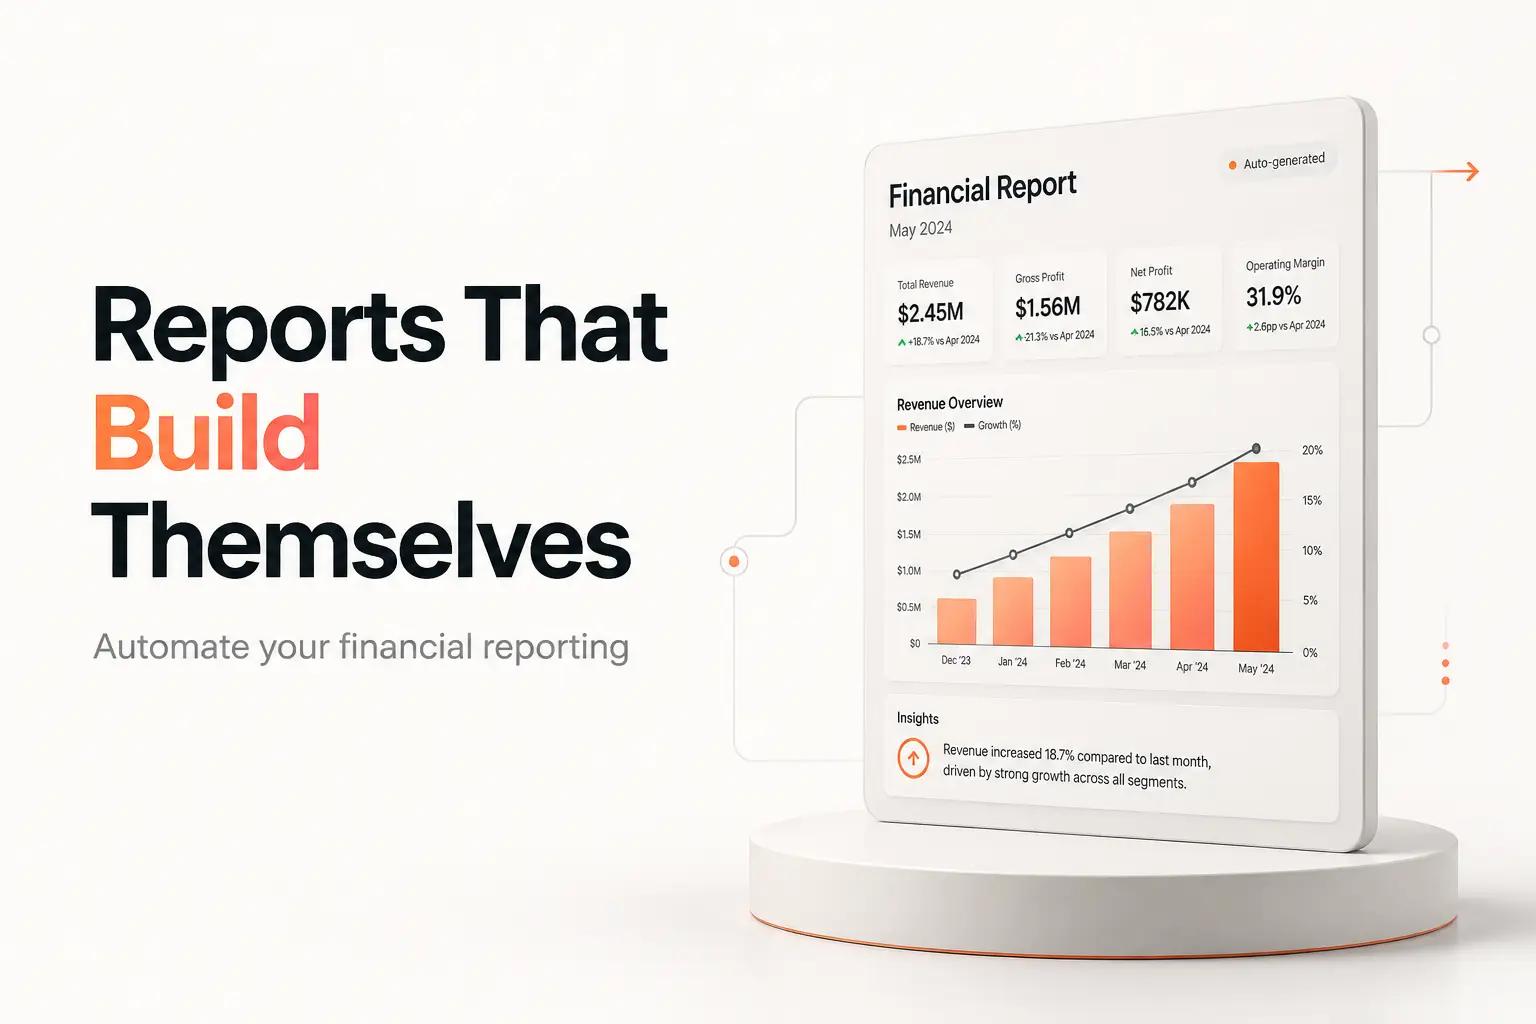
The board deck is due Thursday. It is Wednesday night, and the founder is in a Google Sheet pasting last month's revenue out of QuickBooks, pulling MRR from a Stripe export, grabbing headcount from a spreadsheet HR keeps, and rebuilding the same six charts they rebuilt in August. One cell references the wrong month. Nobody catches it until the board call.
That is the job automated financial reporting is meant to end. Not the accounting, and not the judgment about what the numbers mean. Just the part where a human re-keys figures that already exist in three systems into a report they will rebuild again next month.
The build breaks into a few honest steps, and none of them is the reporting tool you buy. This guide is written for a finance lead or founder running a lean stack, not a 12-person BI team.
Decide what report you are actually automating
"Automate our financial reporting" is not a spec. It is a wish. The first real step is naming the exact deliverable, because a monthly board pack and a daily cash dashboard are different builds with different failure modes.
Pin down three things before you touch a tool:
- The artifact. A board deck, a monthly management P&L, a 13-week cash flow, a departmental budget-vs-actual, a KPI dashboard. Pick one to start.
- The cadence. Monthly after close, weekly on Monday, or live. Cadence decides how hard the data plumbing has to work. A monthly pack can tolerate a manual close step. A live dashboard cannot.
- The audience. Investors need a clean, consistent P&L and a short narrative. A department head needs their own budget line, not the whole company. Same numbers, different cut.
Start with the report that eats the most hours and changes the least month to month. For most lean teams that is the monthly management P&L or the board pack. Both are the same tables and charts every period, which is exactly what a machine is good at and a person resents doing.
Automating the wrong thing first is the most common way this stalls. If you build a live cash dashboard when the real pain is the Wednesday-night board scramble, you have solved a problem nobody was bleeding on.
Map where every number actually lives
A financial report is a join across systems that were never designed to talk to each other. Before you automate the report, write down the source of truth for each line. Not where you usually copy it from, where it is actually correct.
A typical lean-team map looks like this:
| Report line | System of record | How it usually gets pulled |
|---|---|---|
| Revenue, expenses, P&L | QuickBooks Online or Xero | CSV export, then re-keyed |
| MRR, churn, new bookings | Stripe or the billing tool | Dashboard screenshot or export |
| Pipeline, closed-won | HubSpot, Salesforce, Pipedrive | Manual tally |
| Headcount, payroll | Gusto, Rippling, a sheet | Asked HR over Slack |
| Cash position | The bank, or the ledger | Logged in and eyeballed |
The exercise sounds trivial until you do it and find two systems that disagree, the same reconciliation gap that trips up any cross-tool report. Marketing counts a deal as won when the contract is signed. Finance counts it when the invoice is paid. Both are right for their purpose, and a report that silently mixes them is wrong in a way no formula will catch.
Getting the ledger clean and consistent underneath the report matters more than the reporting tool on top. If the close itself is a manual scramble, automate that seam first. We wrote the long version of that argument in the guide to account reconciliation software for lean teams.
Pull the data on a schedule, not by hand
This is the layer everyone underestimates. Connecting an accounting system to a report is not a button. It is an API integration with real limits, and those limits shape what "real-time" can honestly mean.
QuickBooks Online throttles its API at 500 requests per minute per company file, with a maximum of 10 concurrent requests, and returns a 429 Too Many Requests error when you cross either line, per Intuit's developer documentation. Xero is tighter on volume: apps on its Starter tier get 1,000 API calls per connected organization per day, and Core-tier apps get 5,000 per day, again returning a 429 with a Retry-After header when you hit the ceiling, per Xero's OAuth 2.0 API limits.
Those numbers are not academic. They decide the design:
- A monthly or weekly report fits comfortably inside either limit. You pull once, cache the result, and rebuild the report. This is the easy case, and it is most teams.
- A live dashboard that refreshes on every page load will burn through a Xero Starter day of calls fast. You cache the pull and refresh on a schedule instead, so the dashboard reads from your copy, not from Xero every time.
- A sync that ignores the limits works in testing with one small company file and then throws
429s the week you actually need the numbers. Backoff and retry are not optional polish. They are the difference between a report that renders and one that silently shows stale data.
The honest version of "real-time reporting" for a lean team is usually "refreshed every hour" or "refreshed after close," pulled once and cached, not a live wire into your ledger. That is not a compromise. It is the correct design given how these APIs are metered.
If your report also depends on data trapped in PDFs or emailed statements, that is a separate extraction problem, covered in how to automate data entry.
Build the report layer that refreshes itself
Once the data lands somewhere clean on a schedule, the report is the easy part. You have three broad options, and the right one depends on how custom the output has to be.
A connected spreadsheet. Tools that sync QuickBooks or Xero into Google Sheets on a schedule let you build the report with formulas you already know, then refresh the numbers without re-pasting. This is the lowest-friction path for a team that lives in spreadsheets and wants the board pack to stop being a manual rebuild. Vendors in this space price by entity count and scope, and most quote rather than list, so confirm the current number on their own pricing page before you commit.
A dedicated FP&A or reporting tool. Platforms built for financial reporting and planning give you consolidation, budget-vs-actual, and prettier board packs out of the box. They cost meaningfully more and several are quote-only, which for a sub-50-person team is often more platform than the problem needs. Buy this when reporting and planning are a real ongoing function, not a monthly chore.
A custom build. When the report needs numbers from systems no off-the-shelf tool connects, or a cut that no template offers, you build the pull, the transform, and the render yourself. This is where a spreadsheet tool hits its wall and an FP&A platform still cannot cross a boundary its connectors do not cover.
Recommend the first serious upgrade only when the manual rebuild is genuinely the bottleneck. A connected spreadsheet solves more lean-team reporting pain than a five-figure platform does, and it fails in ways a finance lead can actually debug.
Add the checks that stop a wrong number
An automated report that is confidently wrong is worse than a manual one, because everyone trusts it. The founder who used to sanity-check every figure while pasting it now assumes the pipe is correct. This is the step teams skip and regret.
Build these guards into any reporting automation:
- Reconciliation totals. The report's revenue should tie to the ledger's revenue for the same period. If they diverge by more than a cent, the report flags it instead of publishing.
- Freshness stamps. Every number shows when it was last pulled. A dashboard that quietly serves last Tuesday's cash balance because a
429killed the sync is how a team makes a decision on stale data. - Range and sign checks. Negative revenue, a headcount of zero, a 400% expense jump. These are almost always a broken join or a shifted column, not reality. Catch them automatically before a human sees them.
- A human gate on external packs. Anything going to investors or a board gets one person's eyes before it sends. Automate the assembly, not the final sign-off.
The point is to move the human from re-keying numbers to reviewing exceptions. That is the same principle behind every reporting automation we build, and it is why invoice automation works the same way: the machine does the assembly, a person approves the edge cases.
Common mistakes that sink reporting automation
Most failed builds fail the same handful of ways.
Automating a messy close. If your books are not consistently closed on a schedule, automating the report just publishes the mess faster. Fix the close cadence first.
Treating "real-time" as free. As the API limits above show, a live wire into your ledger is a design decision with a cost. Pretending it is free gets you 429 errors and stale dashboards at the worst moment.
No owner. A reporting pipeline that breaks silently and belongs to nobody is a landmine. When Stripe changes an export format or QuickBooks rotates an auth token, someone has to notice and fix it before the next board call, not after.
Hard-coding cell references. A report that breaks the moment someone inserts a row is a manual process with extra steps. Build against named ranges or IDs, not B14.
When to build it yourself and when to bring in bottta
If you run one report on a monthly cadence, your numbers live in QuickBooks and Stripe, and someone on the team is comfortable in Google Sheets, build it yourself with a connected spreadsheet tool. You do not need us for that, and we will tell you so.
Bring in bottta when the report has to cross systems no single tool connects, when "real-time" is a genuine requirement instead of a nice-to-have, or when the pipeline keeps breaking and nobody owns it. That is our work. Our Integrations and Custom Builds practices wire QuickBooks, Xero, Stripe, your CRM, and payroll into one report that pulls on a schedule, respects each API's rate limits with proper backoff, caches so your dashboard is fast, and flags a number that fails a reconciliation check instead of shipping it.
Two ways to work with us. The $4K fixed-scope project fits a defined build: one board pack or dashboard, the integrations included, with 30 days of post-launch support while the first real close runs through it. The $3K per month retainer fits a team that wants reporting plus other automations maintained over time, up to 3 active workflows, with monitoring so a broken sync gets caught and fixed before Thursday, not discovered on the board call. For the fuller decision on doing this in-house versus a studio build, see automation: build vs buy vs hire.
A reporting pipeline is only worth automating if you trust it enough to stop double-checking it. Getting to that trust is mostly the unglamorous parts: rate-limit handling, reconciliation checks, and a clear owner. That is exactly the part a studio earns its fee on.
Frequently asked questions
What is automated financial reporting?
It is a system that pulls figures from your accounting, billing, CRM, and payroll tools on a schedule and assembles them into a report, so a person no longer re-keys numbers that already exist elsewhere. It automates the assembly and the refresh, not the accounting judgment or the final review.
Can I automate reporting straight from QuickBooks or Xero?
Yes, both expose APIs that reporting tools and custom builds connect to. The catch is rate limits. QuickBooks Online allows 500 API requests per minute per company file, and Xero allows 1,000 to 5,000 calls per day per connection depending on tier, per their developer docs. A good build caches the pull and refreshes on a schedule so it stays inside those limits.
Is real-time financial reporting realistic for a small team?
For most lean teams, "refreshed hourly" or "refreshed after close" is the honest and correct version. A true live wire into your ledger burns API calls fast and rarely earns its complexity. Cache the data and refresh on a schedule instead of querying the source on every page load.
How much does it cost to automate financial reporting?
It ranges widely. A connected spreadsheet tool can be a few hundred dollars a month, and dedicated FP&A platforms often run into four or five figures and quote per customer, so check current pricing on each vendor's own page. A done-for-you build with bottta is a $4K fixed-scope project or a $3K per month retainer, integrations included.
What breaks automated reports most often?
Silent failures: an expired auth token, a changed export format, or a rate-limit error that leaves a dashboard showing stale numbers with no warning. This is why freshness stamps, reconciliation checks, and a named owner matter more than the reporting tool you pick.